
September 2026 – Version 1.0
Context and Rationale
This paper should be read as an update and methodological extension of the previous 2019–2024 European UAP Barometer[1]. It is intended to provide a shorter, more focused assessment of recent European reporting trends, while incorporating newly available 2025 data and additional reporting channels.
The need for such an update is reinforced by the broader international context. In the United States, the continued release of official UAP-related files by the Department of War and other federal agencies has kept the subject in the public, political, and institutional arena. The most recent disclosures, including videos, historical files, and reports concerning military encounters and sensitive facilities, illustrate both the growing visibility of UAP as a political issue and the continuing difficulty of reaching clear conclusions from heterogeneous evidence[2]. These developments are important, but they also risk reinforcing a predominantly US-centered view of the subject.
Europe, however, has a long and substantial record of UAP reports, investigations, civilian research organisations, official initiatives, declassified archives, and unresolved cases. Serious UAP research should therefore not be limited to developments in the United States but should also examine the European reporting landscape. This landscape is especially valuable because it brings together national reporting cultures, long-standing civilian groups, official or semi-official bodies such as GEIPAN, international databases, European cases submitted to major US-based organisations such as MUFON and NUFORC, and to newer mobile-app-based platforms such as Enigma Labs.
This update therefore has two purposes. First, it extends the European UAP Barometer to include 2025 data and newly available sources. Second, it argues that European data are not merely supplementary to US developments, but essential for building a broader, comparative, and more balanced understanding of contemporary UAP reporting.
1. Introduction: Purpose and Structure of the 2025 Update
The present paper provides a focused update of the European UAP Barometer for the rolling six-year period 2020-2025. It does not repeat the full historical and methodological framework developed in the previous 2019–2024 edition, but concentrates on new data, new reporting channels, and remaining gaps in European coverage.
The update is organised around three analytical steps. It first explains how reports are collected through national and international organisations. It then examines how reporting volumes have changed over time by source category. Finally, it considers the geographical distribution of reports by country and introduces a preliminary inventory and discussion of unresolved or unidentified cases, as a potential next step in European UAP analysis.
This structure is intended to distinguish reporting mechanisms from reporting geography. Such a distinction is important because changes in report counts may reflect changes in reporting infrastructure, publication rules, or platform adoption, rather than changes in the underlying frequency of unusual aerial observations.
2. Scope and Data Sources: How Reports Are Collected
The data set used in this update brings together several distinct categories of reporting channels. These categories should not be treated as methodologically equivalent.
2.1 National civilian and official organisations
The first category consists of national civilian or official organisations. These remain the strongest basis for country-level analysis because they are embedded in national contexts, often maintain long-term archives, and may conduct case review or classification.
2.2 MUFON and NUFORC as complementary international sources
The second category consists of international reporting databases, primarily MUFON and NUFORC. These sources are valuable because they capture reports from countries without national reporting organisations or from witnesses who choose to submit observations through international platforms. However, they are not necessarily representative of national reporting activity and may be affected by language, awareness, and platform visibility.
The present update does not repeat the full methodological description of MUFON and NUFORC, which was provided in the previous edition. Instead, it incorporates their 2025 European data ascomplementary reporting channels and uses them to extend country coverage where national structures are absent or incomplete.
A methodological caution applies to NUFORC data since 2023. NUFORC’s public website indicates that reports are reviewed, graded, and posted periodically as they are processed, and that reports received before March 2023 have not yet been graded. Additional information suggests that the relationship between submitted and posted reports may also have changed from this period. Therefore, trends involving NUFORC data across 2023 should be interpreted carefully, as changes in published counts may partly reflect changes in processing or posting practices, not only changes in witness reporting behavior.
2.3 Enigma Labs as a mobile-app reporting channel
The third category consists of mobile application-based reporting, represented here by Enigma Labs[3]. This is a new and important addition to the European UAP Barometer and one of the principal developments introduced in the present update. Unlike traditional organisations, Enigma operates through a smartphone application and therefore reflects a different reporting pathway. Its data may capture younger, more digitally engaged, or more spontaneous reporting behaviour. It may also overlap with other reporting channels or include cases that would not otherwise be submitted to national organisations.
Because Enigma Labs represents the introduction of a new smartphone-based reporting mechanism rather than a continuation of traditional reporting channels, changes in report counts after 2023 should be interpreted cautiously. At least part of the reported volume almost certainly reflects changes in reporting behaviour, platform visibility, and app adoption rather than changes in the underlying frequency of unusual aerial observations.
2.4 General methodological caution
For these reasons, this update avoids treating all reports as a single homogeneous dataset. Where combined totals are presented, they should be understood as aggregated reporting-channel totals rather than definitive national totals of UAP observations.
The figures presented here describe reports submitted through available reporting channels. They do not measure the true frequency of unusual aerial phenomena, nor do they imply that all reports are independent, investigated, or unexplained.
3. Annual Reporting Trends by Source, 2020-2025
Before examining the country-level distribution of reports, it is useful to consider the overall annual evolution of available European UAP reports by source category. Table 1 brings together reports from national organisations, MUFON, NUFORC, and Enigma Labs for the 2020-2025 period. These figures should be read as reporting-channel totals rather than as a direct measure of the underlying frequency of unusual aerial phenomena.
The six-year series show a marked high point in 2020, with 6,867 available reports, followed by a clear decrease in 2021 to 4,996 reports. This decrease is important to note, but it should not be overinterpreted as a simple decline in UAP activity.
The year 2020 remains a particular reference point in the recent statistical record, partly because of the high visibility of Starlink satellite launches and associated public reporting effects already discussed in the previous edition of the Barometer. It is therefore more prudent to treat the 2020–2021 difference as part of the reporting context of the dataset rather than as a stand-alone explanatory result.
After 2021, the annual totals return to a broadly comparable range, with 6,018 reports in 2022, 6,404 in 2023, 6,938 in 2024, and 7,193 in 2025. At first sight, this could suggest a gradual recovery or increase in reporting volume. However, the composition of the totals changes significantly over the period. From 2023 onwards, the emergence of Enigma Labs adds a new mobile-app-based reporting layer alongside the long-standing international inputs provided by MUFON and NUFORC.
For this reason, the apparent increase after 2023 should be interpreted with methodological caution. It reflects not only the continuation of established national and international reporting channels, but also the integration of a new digital reporting platform. Similarly, NUFORC data around 2023 require caution because of changes in the review and grading status of reports. The annual totals are therefore useful for describing the available reporting landscape, but they should not be used on their own to infer changes in the actual prevalence of UAP observations across Europe.
Table 1. Annual European reporting totals by source category, 2020-2025
| Year | National organisations | MUFON | NUFORC | Enigma | Total Events |
| 2020 | 6,042 | 707 | 118 | n/a | 6,867 |
| 2021 | 4,325 | 578 | 93 | n/a | 4,996 |
| 2022 | 5,010 | 731 | 277 | n/a | 6,018 |
| 2023 | 4,595 | 718 | 262 | 829 | 6,404 |
| 2024 | 4,446 | 449 | 336 | 1,707 | 6,938 |
| 2025 | 4,480 | 586 | 492 | 1,635 | 7,193 |
4. Geographic Distribution of Reports by Country
Figure 1. Political map of Europe for geographic orientation.[4]
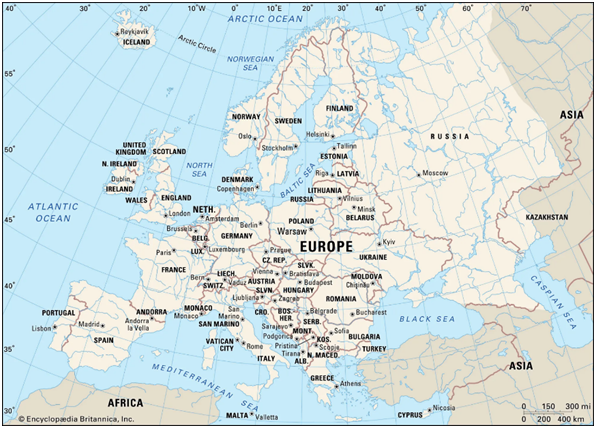
The geographical distribution of reports confirms that Europe is not covered evenly.
Reported volumes remain strongly concentrated in countries with long-standing national organisations, official reporting channels, or highly visible international and digital platforms. Conversely, low numbers in some countries should not be interpreted as evidence of an absence of observations, but rather as an indication of limited reporting infrastructure, lower public visibility, or reliance on foreign-language and international platforms.
Table 2 below presents the country-level totals by year for all countries included in the 2020-2025 dataset. The largest cumulative volumes are concentrated in a small number of countries, notably the Netherlands, the United Kingdom, Germany, Italy, Belgium, Sweden, France, Denmark, and Norway. These countries either benefit from established national reporting systems, substantial international-platform activity, or both. In contrast, many smaller or structurally less-covered countries appear only through low and intermittent numbers, often depending on MUFON, NUFORC, or Enigma Labs submissions rather than resident national organisations.
The table also shows that reporting volumes are not distributed uniformly over time. Some countries display relatively stable annual levels, while others show fluctuations linked to changes in reporting channels, data availability, or newly integrated sources. The totals should therefore be read primarily as indicators of available reporting activity. They do not provide a harmonised measure of national UAP prevalence and should not be used without considering the source structure behind each country.
Table 2. Country-level totals of reported events by year, 2020-2025
| Country | 2020 | 2021 | 2022 | 2023 | 2024 | 2025 | TOTAL |
| Albania | 2 | 2 | 0 | 1 | 5 | 3 | 13 |
| Austria | 8 | 2 | 3 | 16 | 25 | 34 | 88 |
| Belgium | 580 | 276 | 286 | 284 | 239 | 298 | 1,963 |
| Bosnia & Herzegovina | 0 | 2 | 2 | 0 | 5 | 11 | 20 |
| Bulgaria | 2 | 5 | 3 | 10 | 5 | 19 | 44 |
| Croatia | 8 | 7 | 6 | 9 | 8 | 25 | 63 |
| Cyprus | 2 | 2 | 5 | 10 | 4 | 11 | 34 |
| Czech Republic | 133 | 2 | 6 | 15 | 46 | 125 | 327 |
| Denmark | 100 | 89 | 98 | 96 | 122 | 141 | 646 |
| Estonia | 1 | 0 | 2 | 1 | 6 | 1 | 11 |
| Finland | 69 | 76 | 66 | 78 | 104 | 87 | 480 |
| France | 163 | 212 | 356 | 295 | 233 | 183 | 1,442 |
| Germany | 1,121 | 807 | 1,094 | 1,185 | 1,524 | 1,732 | 7,463 |
| Greece | 6 | 4 | 5 | 19 | 25 | 38 | 97 |
| Hungary | 4 | 0 | 7 | 20 | 14 | 23 | 68 |
| Iceland | 2 | 2 | 4 | 6 | 4 | 2 | 20 |
| Ireland | 27 | 27 | 31 | 38 | 44 | 62 | 229 |
| Italy | 409 | 270 | 623 | 549 | 679 | 419 | 2,949 |
| Kosovo | 0 | 0 | 1 | 0 | 0 | 0 | 1 |
| Latvia | 1 | 1 | 0 | 0 | 1 | 0 | 3 |
| Lithuania | 0 | 0 | 4 | 2 | 10 | 6 | 22 |
| Luxembourg | 1 | 0 | 1 | 0 | 1 | 0 | 3 |
| Malta | 5 | 0 | 2 | 4 | 2 | 6 | 19 |
| Moldova | 1 | 0 | 0 | 0 | 2 | 1 | 4 |
| Montenegro | 1 | 0 | 1 | 3 | 0 | 3 | 8 |
| The Netherlands | 2,028 | 1,681 | 1,661 | 1,431 | 1,331 | 1,386 | 9,518 |
| North Macedonia | 1 | 0 | 0 | 1 | 3 | 4 | 9 |
| Norway | 76 | 27 | 64 | 101 | 110 | 158 | 536 |
| Poland | 24 | 6 | 6 | 18 | 39 | 53 | 146 |
| Portugal | 3 | 19 | 31 | 45 | 167 | 187 | 452 |
| Romania | 8 | 14 | 28 | 48 | 67 | 9 | 174 |
| Russia | 76 | 43 | 71 | 47 | 44 | 19 | 300 |
| Serbia | 4 | 5 | 1 | 9 | 4 | 3 | 26 |
| Slovakia | 2 | 3 | 1 | 5 | 5 | 22 | 38 |
| Slovenia | 10 | 3 | 2 | 7 | 1 | 6 | 29 |
| Spain | 74 | 39 | 43 | 83 | 83 | 137 | 459 |
| Sweden | 300 | 282 | 244 | 289 | 295 | 352 | 1,762 |
| Switzerland | 11 | 6 | 11 | 17 | 43 | 43 | 131 |
| Ukraine | 23 | 11 | 6 | 8 | 17 | 15 | 80 |
| United Kingdom | 1,581 | 1,071 | 1,243 | 1,654 | 1,621 | 1,569 | 8,739 |
| TOTAL | 6,867 | 4,996 | 6,018 | 6,404 | 6,938 | 7,193 | 38,416 |
Note: Country totals combine reports from national organisations, MUFON, NUFORC, and Enigma Labs where available. They are reporting-channel totals, not harmonised national totals. Enigma Labs data begin in 2023. NUFORC introduced more selective pre-publication screening around March 2023, creating a methodological break in its public time series; counts before and after this point may therefore reflect different publication practices as well as changes in reporting activity. Comparisons across the period should consequently be interpreted with caution.
Table 3 clarifies this source structure. It shows that the geographic coverage of the Barometer is derived from four different reporting layers: national organisations, MUFON, NUFORC, and Enigma Labs.
In countries with established national organisations, these local or national sources remain the most meaningful basis for interpretation. In other countries, however, the available data are derived entirely or mainly from international databases or app-based reporting. This distinction is important because it affects the interpretation of country totals: a low figure may reflect limited access to reporting channels rather than a low level of public observations, while a higher figure may partly reflect the visibility of a particular platform.
Table 3. Data availability by country and source, 2020-2025
| Country | National organisations | MUFON | NUFORC | Enigma Labs (from 2023) | 2025 status | TOTAL |
| Albania | 0 | 6 | 6 | 1 | 13 | |
| Austria | 0 | 46 | 10 | 32 | 88 | |
| Belgium | 1,909 | 16 | 21 | 17 | 1,963 | |
| Bosnia & Herzegovina | 0 | 1 | 7 | 12 | 20 | |
| Bulgaria | 0 | 19 | 9 | 16 | 44 | |
| Croatia | 0 | 30 | 22 | 11 | 63 | |
| Cyprus | 0 | 14 | 12 | 8 | 34 | |
| Czech Republic | 225 | 8 | 28 | 66 | 327 | |
| Denmark | 628 | 6 | 11 | 1 | 646 | |
| Estonia | 0 | 6 | 4 | 1 | 11 | |
| Finland | 456 | 8 | 8 | 8 | 480 | |
| France | 395 | 960 | 32 | 55 | 1,442 | |
| Germany | 7,183 | 33 | 75 | 172 | 7,463 | |
| Greece | 35 | 7 | 30 | 25 | 97 | |
| Hungary | 0 | 42 | 19 | 7 | 68 | |
| Iceland | 0 | 6 | 10 | 4 | 20 | |
| Ireland | 0 | 109 | 79 | 41 | 229 | |
| Italy | 2,517 | 120 | 36 | 276 | Partial inputs from Nat. Org. | 2,949 |
| Kosovo | 0 | 0 | 1 | 0 | 1 | |
| Latvia | 0 | 2 | 0 | 1 | 3 | |
| Lithuania | 0 | 5 | 10 | 7 | 22 | |
| Luxembourg | 0 | 2 | 1 | 0 | 3 | |
| Malta | 0 | 9 | 5 | 5 | 19 | |
| Moldova | 0 | 2 | 2 | 0 | 4 | |
| Montenegro | 0 | 4 | 1 | 3 | 8 | |
| The Netherlands | 9,425 | 14 | 39 | 40 | 9,518 | |
| North Macedonia | 0 | 1 | 4 | 4 | 9 | |
| Norway | 474 | 12 | 28 | 22 | 536 | |
| Poland | 0 | 71 | 30 | 45 | 146 | |
| Portugal | 374 | 23 | 26 | 29 | New source in 2025 | 452 |
| Romania | 145 | 9 | 10 | 10 | National data pending | 174 |
| Russia | 248 | 30 | 17 | 5 | Missing national data | 300 |
| Serbia | 0 | 14 | 7 | 5 | 26 | |
| Slovakia | 0 | 19 | 5 | 14 | 38 | |
| Slovenia | 0 | 19 | 7 | 3 | 29 | |
| Spain | 135 | 146 | 56 | 122 | 459 | |
| Sweden | 1,693 | 1 | 24 | 44 | 1,762 | |
| Switzerland | 6 | 39 | 14 | 72 | 131 | |
| Ukraine | 50 | 16 | 8 | 6 | 80 | |
| United Kingdom | 3,000 | 1,894 | 864 | 2981 | Missing inputs from Nat. Org. | 8,739 |
| TOTAL | 28,898 | 3,769 | 1,578 | 4,171 | 38,416 |
Taken together, Tables 2 and 3 therefore show both the progress and the continuing limitations of the European UAP Barometer. The dataset now offers broader continental coverage than earlier editions, but the quality and meaning of that coverage remain uneven. For this reason, national organisations continue to provide the strongest basis for country-level analysis. The next section therefore focuses specifically on these organisations, their continuity, newly integrated data such as Portugal, and remaining gaps in countries where important inputs are still incomplete or pending.
5. National Organisations: Continuity, Portugal, and Missing Inputs
5.1 Portugal: A newly integrated national dataset
The inclusion of Portuguese data represents one of the most significant improvements introduced in the recent editions of the European UAP Barometer. Portuguese reporting was already strengthened in the previous edition through the incorporation of data from CTEC-STELLAR, an organisation established in 2023, as a transformation of previous long-standing organizations (CEAFI, CNIFO, CTEC) that provided valuable national reporting statistics. The present update further improves Portuguese coverage through the addition of data supplied by CIFA, which has made available retrospective reporting figures extending back to 2021.
Together, these two organisations considerably enhance the representation of Portugal within the European dataset, improve historical continuity, and illustrate how both newly established and newly arriving national initiatives can strengthen long-term European monitoring and comparative analysis.
5.2 Missing or partial national inputs
The continued absence of complete UK data, particularly from BUFORA and UFO Identified, remains one of the most significant limitations of the 2025 update. Similarly, missing data from CUN in Italy, and yet missing inputs from ASFAN in Romania, underline the continuing dependence of European UAP statistics on voluntary, decentralised reporting infrastructures.
The figures presented in this paper reflect the data available at the time of finalisation. Should substantial missing or retrospective national data become available after publication, an updated and clearly identified version may be issued.
5.3 Contributing national organisations and institutional sources
Table 4 provides an overview of the national organisations and institutional sources that contributed directly or indirectly to the primary European dataset used in this update.
Table 4. National organisations and institutional sources contributing to the primary European dataset
| Country | Organisation / source | Year established | Type / status | Website / reporting page |
| Belgium | Belgisch UFO Meldpunt (Flanders) | 2007 | Civilian organisation | https://ufomeldpunt.be/publicaties/jaarverslagen |
| COBEPS (Wallonia & Brussels), continuation of SOBEPS (1971-2007) | 2007 | Civilian organisation | https://www.cobeps.org/en/notifications | |
| Czech Republic | Tým Záře (revitalised Projekt Záře 1992-2022) | 2025 | Civilian organisation | http://www.projektzare.cz/ |
| Denmark | SUFOI | 1957 | Civilian organisation | http://www.sufoi.dk/obs/obs-2023/obs-2023.php |
| Finland | FUFORA | 1973 | Civilian organisation | https://www.fufora.fi/ufodb2/ufohaku.php?sid= |
| France | GEIPAN (within CNES) | 1977 | Official body | https://www.cnes-geipan.fr/fr/stats |
| Germany | CENAP | 1976 | Civilian organisation | https://www.hjkc.de/25.html |
| GEP | 1972 | Civilian organisation | https://zenodo.org/doi/10.5281/zenodo.10547072 | |
| Greece | GRUFON | 2025 | Civilian organisation | https://www.grufon.org/ |
| Italy | CISU | 1985 | Civilian organisation | https://www.cisu.org/ |
| CUN | 1966 | Civilian organisation | https://www.cun-italia.com/ | |
| MUFON- Italia | 2012 | Civilian organisation | https://mufon-italia.e-monsite.com/ | |
| Aeronautica Militare | 1978 | Official body | https://www.aeronautica.difesa.it/ovni/ | |
| The Netherlands | UFO Meldpunt Nederland | 2011 | Civilian organisation | https://www.ufomeldpunt.nl/statistieken |
| Norway | Norsk UFO Center | 2016 | Civilian organisation | https://norskufosenter.no/ |
| Portugal | CTEC- STELLAR (continuation of CEAFI, CNIFO, CTEC 1973-2023 | 2023 | Civilian organisation | https://stellar.com.pt/ |
| CIFA | 2021 | Civilian organisation | https://cifa.pt | |
| | ||||
Romania | ASFAN | 1998 | Civilian organisation | https://www.asfan.ro/english.htm |
| Spain | CEI (only Catalonia) | 1958 | Civilian organisation | https://www.el-cei.org/ |
| Proyecto-Cuco (revitalised in 2025) | 2002 | Civilian organisation | https://proyecto-cuco.blogspot.com/ | |
| Sweden | UFO-Sverige | 1970 | Civilian organisation | https://www.ufo.se/ |
| Ukraine | SRCAA "ZOND" | 2004 | Civilian organisation | https://zond.kiev.ua/ |
| United Kingdom | BUFORA | 1964 | Civilian organisation | https://www.bufora.org.uk/ |
| UFO Identified | 2020 | Civilian organisation | https://ufoidentified.co.uk/ufo-report-2023 |
The collection includes a mixture of long-established civilian organisations, official or semi-official bodies, and more recently established initiatives. Some organisations, such as SUFOI in Denmark, FUFORA in Finland, UFO-Sverige in Sweden, GEIPAN in France, CISU in Italy, CENAP and GEP in Germany, BUFORA in the United Kingdom have accumulated decades of experience in collecting and reviewing reports. Others represent newer initiatives that contribute to the continuing development of the European reporting landscape.
The diversity of contributors also illustrates the decentralised character of European UAP reporting. No single organisation covers the entire continent, and reporting practices, publication methods, and case-management approaches differ substantially between countries. The Barometer therefore depends on cooperation with a broad network of national organisations willing to publish, share, or authorise the use of aggregated reporting statistics. This collaborative structure remains one of the major strengths of the project, but also one of its principal methodological constraints.
5.4 National reporting table
Table 5 summarises the annual reporting figures supplied by participating national organisations and institutional contributors between 2020 and 2025.
Table 5. Annual reports provided by national organisations and institutional sources, 2020-2025
| Country | Organisation | 2020 | 2021 | 2022 | 2023 | 2024 | 2025 | TOTAL | 2025 status |
| Belgium | Belgisch UFO Meldpunt | 458 | 197 | 221 | 229 | 164 | 237 | 1506 | |
| COBEPS | 122 | 78 | 63 | 51 | 52 | 37 | 403 | ||
| Czech Republic | Tým Záře | 131 | 0 | 5 | 8 | 27 | 54 | 225 | |
| Denmark | SUFOI | 100 | 89 | 98 | 92 | 121 | 128 | 628 | |
| Finland | FUFORA | 68 | 76 | 65 | 75 | 99 | 73 | 456 | |
| France | GEIPAN (within CNES) | 60 | 67 | 72 | 73 | 61 | 62 | 395 | |
| Germany | CENAP | 895 | 611 | 729 | 807 | 1106 | 1348 | 5,496 | |
| GEP | 216 | 190 | 354 | 342 | 334 | 251 | 1,687 | ||
| Greece | GRUFON | 5 | 4 | 3 | 6 | 8 | 9 | 35 | |
| Italy | CISU | 158 | 85 | 267 | 161 | 534 | 315 | 1,520 | |
| CUN | 229 | 166 | 319 | 246 | 960 | No data 2024/2025 | |||
| Aeronautica Militare | 2 | 11 | 14 | 3 | 4 | 3 | 37 | ||
| The Netherlands | UFO Meldpunt Nederland | 2026 | 1680 | 1659 | 1419 | 1312 | 1329 | 9,425 | |
| Norway | Norsk UFO Center | 72 | 25 | 62 | 101 | 92 | 122 | 474 | |
| Portugal | CTEC- STELLAR | 77 | 106 | 183 | Data from 2024 | ||||
| CIFA | 19 | 31 | 33 | 55 | 53 | 191 | New contributor | ||
| Romania | ASFAN | 8 | 13 | 27 | 43 | 54 | 145 | Pending 2025 data | |
| Spain | CEI (only Catalonia) | 16 | 11 | 13 | 11 | 8 | 7 | 66 | |
| Proyecto-Cuco | 24 | 3 | 3 | 8 | 11 | 20 | 69 | ||
| Sweden | UFO-Sverige | 299 | 282 | 241 | 274 | 277 | 320 | 1,693 | |
Ukraine | SRCAA "ZOND" | 18 | 5 | 3 | 6 | 12 | 6 | 50 | See special note below |
| United Kingdom | BUFORA | 583 | 259 | 200 | 169 | 1,211 | Pending 2024/25 data | ||
| UFO Identified | 484 | 413 | 497 | 315 | 1,789 | No 2024/25 data |
Several contributors demonstrate remarkable continuity over the six-year period. Organisations such as UFO Meldpunt Nederland, UFO-Sverige, CENAP, GEP, SUFOI, FUFORA, COBEPS, and Belgisch UFO Meldpunt continue to provide regular reporting statistics and form a substantial share of the overall European dataset. Their long-term contribution helps ensure consistency in country-level monitoring and provides an essential reference framework against which other sources can be compared.
The inclusion of Portuguese data represents one of the most significant improvements introduced in this update. As shown in Tables 4 and 5, Portuguese reporting now benefits from the contributions of both CTEC-STELLAR and CIFA, providing not only current information but also retrospective data extending back to 2021. This addition considerably improves Iberian coverage and demonstrates how new contributors can enhance both current and historical European dataset.
At the same time, the table highlights the continuing challenges associated with voluntary and decentralised reporting infrastructures. Several countries remain affected by incomplete or delayed inputs. In the United Kingdom, important data from BUFORA and UFO Identified remain partially unavailable for recent years. Italy continues to face gaps associated with the unavailability of CUN statistics. Romania is also affected by missing 2025 ASFAN data. As this is the first year for which ASFAN statistics were not available at the time of publication, Romanian totals should be interpreted with appropriate caution. These limitations do not invalidate the available figures, but they demonstrate that European reporting totals remain dependent on contributor continuity and publication practices.
The figures shown in Table 5 should therefore be interpreted primarily as indicators of reporting activity documented by participating organisations. Differences between countries may reflect genuine variations in reporting volume, but they may also result from institutional continuity, archive accessibility, reporting visibility, and changes in contributor participation. The figures should therefore be interpreted in relation to the organisational context in which they are produced.
Finally, the figures reported for Ukraine in Table 5 correspond to the contribution incorporated into the European Barometer dataset and should not be confused with the much larger volume of observations recorded through the Ukrainian ePPO air-defence reporting system. A special methodological consideration applies to Ukraine and is discussed separately below.
Special note: Ukraine and wartime aerial reporting
As in the previous edition of the European UAP Barometer, Ukraine warrants separate consideration because its reporting environment differs fundamentally from those of other European countries. Ukraine remains a special case within the European dataset because aerial observations are recorded under ongoing wartime conditions. Alongside reports collected by SRCAA “Zond”, a substantial number of observations are received through the Ukrainian government's ePPO (“electronic air defence”) reporting system. The ePPO application enables civilians to report real-time coordinates of observed objects and phenomena in the aerospace domain and includes predefined categories for aircraft, drones, missiles, helicopters, aerial explosions, and other known aerial objects.
A dedicated “UFO” option is available for observations that witnesses are unable to identify at the time of reporting, thereby creating a distinct subset of initially unidentified reports that may subsequently be analysed separately from reports involving known aerial objects. For research purposes, ePPO-derived inputs are subsequently filtered and analysed separately from the total volume of reports received through all sources. This distinction is important because the ePPO system operates primarily as an air-defence reporting tool rather than a civilian UAP reporting platform. As shown in Table 6, the total volume of ZOND Array Primary Reports increased markedly in 2025, largely reflecting the growing use of the ePPO system and the increasing saturation of Ukrainian airspace with both hostile and friendly aerial assets. By contrast, the filtered subset of civilian “unidentified” reports recorded outside active air-alert periods remained broadly comparable to previous years.
Ukrainian figures should therefore not be interpreted in the same way as civilian UAP reporting statistics from other European countries, but rather as observations collected within a unique operational environment where civilian reporting, air-defence monitoring, and scientific analysis interact under wartime conditions.
Table 6. Ukrainian UAP-related primary inputs and filtered civilian ePPO reports (2023–2025)
| Year | ZOND Array Primary Reports (all sources, including ePPO) | Filtered civilian “unidentified” reports via ePPO (subset) |
| 2023 (since 28 May) | 8,212 | 1,849 |
| 2024 (up to 18 Nov.) | 8,735 | 3,410 |
| 2025 | 18,025 | 3,492 |
Source: ZOND (2026). Adapted from Artem Bilyk and Kyrylo Nikolaiev, Ukrainian Military Observations and Analysis of Aerospace Objects and Phenomena during Defense against the Russian Federation, CTX Special Issue 2026, Naval Postgraduate School, pp. 32–40, available at https://nps.edu/documents/110773463/165192597/CTX-EAG-Special-Issue-2026.pdf.
6. Selected Country Comparisons by Reporting Channel
The purpose of this section is not to draw conclusions about the true prevalence of UAP observations, but rather to illustrate how different reporting channels can shape the statistical profile of a country. The examples presented here demonstrate that national organisations, international reporting databases, and mobile-app-based platforms may capture different segments of the reporting population. Because Enigma Labs data are available only from 2023 onwards, the comparison is limited to the most recent three-year period (2023–2025), during which all four reporting channels can be examined simultaneously.
6.1 France: official, international, and mobile reporting channels
The French example illustrates why reporting-channel comparisons are analytically useful. GEIPAN represents the official national reporting structure, MUFON and NUFORC capture submissions made to international platforms, and Enigma Labs reflects mobile-app-based reporting. Figure 2 compares these four reporting pathways over the 2023-2025 period and shows how substantially different statistical profiles can emerge within the same country depending on the reporting mechanism used.
Figure 2. France: comparison of official, international, and mobile reporting channels (2023–2025)
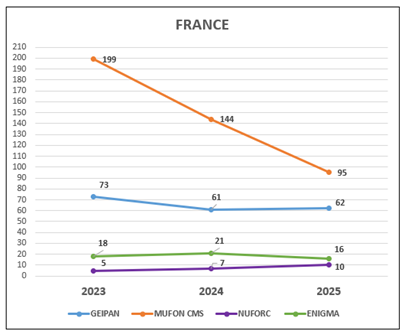
Figure 2 highlights the extent to which reporting-channel choice influences the statistical visibility of UAP reports. During the 2023–2025 period, submissions recorded through the MUFON Case Management System substantially exceeded those appearing in the GEIPAN statistics, while NUFORC and Enigma Labs provided smaller but distinct reporting streams. The comparison illustrates that reporting volumes are influenced not only by observations themselves, but also by witness awareness, platform visibility, and reporting preferences.
The French example also highlights an important methodological distinction regarding official reporting statistics. According to information provided by GEIPAN, the annual figures published on its public statistics pages correspond only to cases that proceed to investigation and publication. They do not represent the total volume of public contacts or observation-related submissions received by the organisation. For example, GEIPAN reported approximately 4,900 contacts from the public and approximately 1,800 observation-related submissions in 2025, while only 62 investigated cases entered at today’s date the published statistical series. Many observations are filtered out at earlier stages because they are rapidly identified, incomplete, outside the geographical scope of the organisation, or not authorised for publication.
The French case therefore demonstrates that publicly available statistics may reflect different stages of filtering, assessment, investigation, and publication rather than the total volume of incoming observations. More generally, it reinforces one of the central methodological conclusions of this Barometer: understanding reporting channels is a necessary prerequisite for interpreting national reporting totals and comparing countries meaningfully.
6.2 Portugal: the value of newly integrated national reporting
The Portuguese case illustrates a different aspect of the European reporting landscape. Whereas the French example demonstrates how different reporting channels can generate substantially different statistical profiles within the same country, Portugal highlights the importance of strengthening national reporting coverage through the integration of additional national sources.
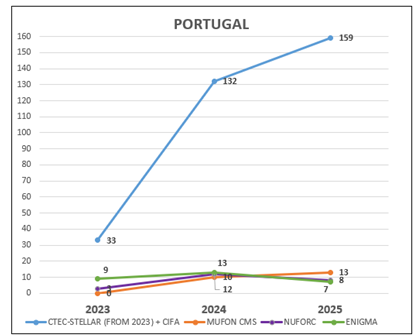
Figure 3. Portugal: national, international, and mobile reporting channels (2023–2025)
Portugal was already represented in previous editions of the Barometer through the contribution of CTEC-STELLAR. The 2025 update, however, benefits from the incorporation of data from CIFA, providing additional national coverage and improving the overall completeness of the Portuguese dataset. The availability of retrospective information extending back to 2021 further improves the historical continuity of Portuguese reporting.
Figure 3 illustrates how substantially national reporting structures can influence the statistical visibility of a country. During the 2023–2025 period, reports collected through the combined contribution of CTEC-STELLAR and CIFA greatly exceeded those submitted through MUFON, NUFORC, or Enigma Labs. In contrast to the French example, where an international database represented the largest visible reporting stream, the Portuguese case demonstrates the predominance of national reporting mechanisms when active and accessible reporting organisations are present.
The incorporation of CIFA data into the 2025 update not only increases the number of available reports but also improves the completeness and historical continuity of the Portuguese dataset. The example therefore illustrates that changes in national reporting totals may result not only from variations in witness reporting behaviour, but also from changes in reporting infrastructure and contributor participation.
More generally, the French and Portuguese examples illustrate two complementary dimensions of European UAP reporting. France demonstrates how reporting pathways influence statistical visibility, while Portugal shows how improvements in reporting infrastructure can strengthen national coverage. Together they reinforce one of the central methodological conclusions of this Barometer: understanding how reports are collected is as important as understanding how many reports are collected.
7. Beyond Counting Reports: Towards an Inventory of Unidentified Cases
Understanding how reports are collected is only part of the analytical challenge. An equally important question concerns what becomes of those reports after investigation. A limitation of most UAP reporting summaries is that they count reports rather than outcomes. Yet from a scientific and analytical perspective, the most important subset is not the total number of observations submitted, but the much smaller number that remains unexplained after review.
This issue is methodologically difficult because classifications are not harmonised across organisations. “Unidentified”, “unexplained”, “D case”, “D1”, “insufficient data”, and “unresolved” may mean different things. Some organisations publish case-level details, others only annual summaries, and some do not clearly distinguish between uninvestigated and unresolved reports. The importance of this issue was already highlighted in the previous edition of the European UAP Barometer, which suggested that future updates should move beyond reporting case frequencies and progressively incorporate information on cases that remain unresolved after investigation.
Table 7. Pilot inventory of unresolved or unidentified cases by country, 2019-2025
| Country | Organisation | Classification used | Total unidentified / unresolved cases |
| Belgium | Belgisch UFO Meldpunt | Unidentified cases | 4 |
| Czech Republic | Tým Záře | Unidentified cases | 4 |
| France | GEIPAN | cases classified "D" | 7 |
| Sweden | UFO-Sverige | Annual reports "cat. D" | 2 |
| Ukraine | ZOND | Unidentified cases "D1" | 8 |
Although some unresolved individual cases have been identified by participating organisations and are publicly documented in some countries, the present dataset remains too incomplete to support a meaningful European case catalogue. Future editions may therefore include both a statistical inventory of unresolved cases and, where sufficient information is available, a repository of selected case descriptions.
The preliminary inventory confirms both the relatively small number of cases classified as unidentified/unresolved and their methodological importance. However, several organisations do not yet publish classification statistics, while others continue to discuss internally how such classifications should be defined, reviewed, and reported. As a result, the availability and comparability of data remain uneven.
The preliminary inventory presented here should therefore be regarded as a proof of concept rather than a comprehensive European catalogue of unresolved cases. Nevertheless, it demonstrates that moving beyond report counts toward outcome-based indicators is both possible and analytically valuable. Future editions of the European UAP Barometer could therefore include two complementary indicators: total reports submitted and cases remaining unresolved after assessment.
8. Conclusion
The 2025 update confirms both the value and the continuing evolution of the European UAP Barometer as a cooperative instrument for monitoring reported UAP activity across Europe. By incorporating 2025 national data, updated MUFON and NUFORC submissions, Portuguese data extending back to 2021, and Enigma Labs reporting for the 2023-2025 period, the present study broadens the empirical basis of European UAP reporting while also clarifying several important methodological limitations.
The evidence presented throughout this report demonstrates that European UAP reporting is best understood as a diverse reporting ecosystem composed of national organisations, international databases, and emerging digital reporting platforms. Within this ecosystem, national organisations provide the principal reference point for country-level interpretation. At the same time, international databases such as MUFON and NUFORC, together with newer app-based platforms such as Enigma Labs, considerably expand the geographical reach of the dataset and provide additional reporting pathways that would otherwise remain poorly documented.
The central methodological lesson of the 2025 update is that European UAP reporting should be analysed by reporting source before being compared by country. Differences in reporting structures, publication practices, degrees of case review, platform visibility, and reporting behaviour can significantly influence the statistical visibility of reports. Apparent increases or decreases in reporting volumes may therefore reflect changes in reporting infrastructure, contributor continuity, publication policies, or platform adoption rather than changes in the underlying frequency of unusual aerial observations.
The country-level analysis further confirms that Europe remains unevenly covered. Countries supported by long-established reporting organisations continue to dominate the available statistics, while many others remain dependent on international databases or newer digital reporting platforms. At the same time, the integration of Portuguese data demonstrates how new contributors can substantially improve both contemporary and historical coverage. Conversely, continuing gaps in important national inputs, particularly in the United Kingdom, Italy, and Romania, illustrate the enduring dependence of the Barometer on voluntary cooperation and decentralised reporting networks.
The examples of France and Portugal also highlight the importance of understanding reporting pathways when interpreting statistical results. The same country may appear very different depending on whether observations are submitted through national organisations, international databases, or mobile reporting applications. Reporting totals should therefore be understood primarily as indicators of documented reporting activity rather than direct measures of the prevalence of unusual aerial phenomena.
The present update also points toward a next stage in European UAP research. While previous editions of the Barometer have focused principally on reporting volumes, the very first pilot inventory of unresolved or unidentified cases introduced in this report suggests a complementary direction for future work. Although classification systems remain heterogeneous and available data remain incomplete, the systematic documentation of cases that remain unresolved after investigation would represent a significant methodological advance. Understanding the outcomes of investigations is arguably as important as understanding the volume of reports received.
In this context, the joint initiative to establish a public Euro UFO Index represents an important step toward continental visibility and cooperation. Complementing this index with a dedicated inventory of formally unresolved or unidentified cases, based on classifications provided by participating national organisations, would not aim to increase reporting volume but rather to improve analytical relevance, transparency, and comparability. Where feasible, extending this approach across Europe could provide a more meaningful framework for comparative research than report counts alone.
Should substantial missing or retrospective national data become available after publication, they may be incorporated into a clearly identified revised version of the Barometer.
Ultimately, the European UAP Barometer should not be viewed as a measurement of the true frequency of unusual aerial phenomena. Rather, it is a collaborative framework for documenting and analysing the reporting landscape available across Europe. Future editions should therefore continue to update annual reporting volumes while also refining indicators of data quality, reporting pathways, classification outcomes, and unresolved-case status. In this way, the Barometer can continue its gradual evolution from a descriptive statistical overview toward a more analytically robust instrument for comparative European UAP research, while also encouraging greater cooperation and exchange among the organisations and researchers contributing to the study of UAPs in Europe.
Acknowledgments
The author gratefully acknowledges the many national coordinators, investigators, and researchers who continue to make their data, expertise, and observations available for this annual study. The European UAP Barometer remains fundamentally dependent on the voluntary contributions of national organisations and research groups across Europe, whose commitment to documentation, transparency, and long-term continuity makes comparative European analysis possible.
Special thanks are extended to Edoardo Russo (CISU), founding member of EuroUFO.Net and UAP Check board, for his longstanding support and valuable assistance in the preparation of this update. The author also wishes to express his sincere gratitude to Bob Spearing, MUFON Director of International Investigations, and Christian Stepien, NUFORC Chief Technology Officer, for once again authorising the use of MUFON and NUFORC data for the present update. Following their support for the previous European UAP Barometer, their continued cooperation has enabled the inclusion of updated aggregated European statistics and has significantly contributed to the continuity and comparative breadth of this research.
The author further wishes to thank Enigma Labs for making European reporting data available for this study and thereby broadening the range of reporting channels examined in this edition of the Barometer. Particular thanks are due to Alejandro Rojas for his assistance and cooperation.
Special appreciation is also extended to Dr. Mark Rodeghier (CUFOS) for reviewing the manuscript and for his continued advice, encouragement, and thoughtful comments throughout the preparation of this report.
Finally, thanks are extended to Giorgio Abraini for his careful review of the manuscript and for providing constructive observations and suggestions that helped improve the clarity and overall quality of the report.
Notes
[1] https://www.uapcheck.com/news/european-uap-sightings-in-2019-2024-towards-a-broader-and-more-inclusive-euro-ufo-barometer/3239/
[2] U.S. Department of War, “Department of War Releases Unidentified Anomalous Phenomena Files in Historic Transparency Effort,” news release, 8 May 2026, https://www.war.gov/News/Releases/Release/Article/4480582/department-of-war-releases-unidentified-anomalous-phenomena-files-in-historic-t/
[3] Enigma Labs, “About Enigma,” accessed 5 August 2026, https://enigmalabs.io/about
[4] Map source: Encyclopaedia Britannica, political map of Europe, accessed 5 August 2026, https://cdn.britannica.com/67/367-050-CCA16287/Europe-political-boundaries-continent.jpg.
Cover image: Adapted from European Union, Copernicus Sentinel-2 imagery, 9 May 2026.